Table Of Contents:
You’ve been creating content like crazy! Awesome job!
But how do you measure if it’s effectiveness?
How do you know that you’re really getting the highest ROI for your efforts?
Simple put, you need to analyze your results on a regular basis.
Measuring your results is as important as creating the content itself. Constant measurement can help you understand what’s wrong with your content and how to improve any mistakes you’ve made along the way.
In fact, effective content marketing is the mix of a good strategy, clearly defined goals and regular analysis of results.
Now, let’s find out how to measure your content marketing performance.
Setting the Right Goals and KPIs
Before diving headfirst and measuring random metrics you should make sure that you have clearly defined goals.Why are you creating content? What’s the purpose of all your efforts, ask yourself.
More sales? Makes sense, the main goal of most brands is to generate good profit.
Increased traffic? Sounds fair.
More newsletter subscribers? Great, your email marketing game is on point.
Setting goals is part of your overall content creation strategy, and I briefly touched upon this in my Content Creation, Part 1 guide.
Setting clear goals is good and all but it will only help you if you run through them before measuring your content marketing performance. Besides, each goal should also have its KPIs (key point indicators), which would make the tracking process easier for everyone involved (especially if you are working with a client).
Let’s say your goal is to have 1000 new visits to the website every month, which could be achieved by e.g. creating more quality content or attracting visitors with social media campaigns. This way you can track every set period of time if you’ve achieved your KPIs, and if not, you can make some improvements to make sure next month your content performance is much better.
A friendly note: before setting rigid goals do a bit of research, if you haven’t already. Every industry is different and while for your business it can be completely acceptable to have 1000 visitors in a month, for another brand, it could be a disaster. So, analyze your current position, your performance, the industry and your competitors. All this data can help you define more realistic goals. However, for each content type, the key metrics are different, so make sure to fully understand your content’s specific characteristics.
Key Content Marketing Metrics to Measure
Once you’ve defined your goals and KPIs, it’s time to explore all the important group metrics for content marketing performance. I’ve tried to compile all the important metrics that came to mind but you don’t have to keep track of each one.You can easily choose the ones that are important for your specific content marketing goals.
Behavior Metrics
The first important group is user behavior metrics, obviously. I mean you need to know how people interact with your website, right? Where they find you, how many people visit your website every day, which pages are more popular and many others.So it’s a no-brainer that you should include at least one of these metrics, if not all in your strategy, as it basically shows if people are interested in your content or not, which is crucial for your success.
Now let’s explore each one in detail.
Pageviews
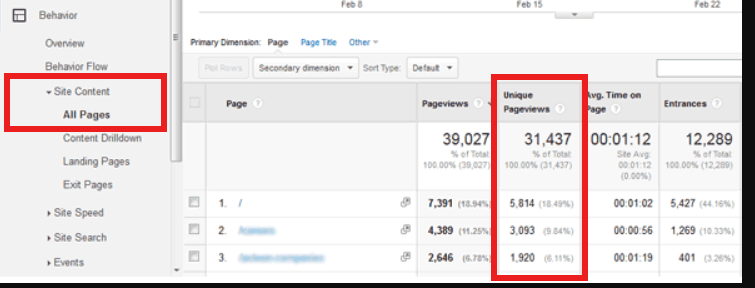
Pageviews indicate how many times a certain page on your website was visited. This metric shows which pages are more interesting for your audience, how many times they visit it, how well your content performs in comparison with other content creators. This data can help you understand your audience better, discover what they like and what they don’t like and create your future content according to their preferences.To see pageviews on Google Analytics, go to Audience — Overview. If you want to see more details then go to Google Analytics — Behavior — Site Content — All Pages. This option will show you the numbers for specific pages, as well as unique pageviews.

Another source of data for Wordpress or other CMS users is the platform’s built-in statistics. And this doesn’t apply to CMS platforms only. Even websites made from scratch have built-in analytics so you can easily access it in your admin panel. I personally find it quite handy and not only for checking visitors.

Unique Pageviews
On to the next user behaviour metric - unique pageview. It shows the number of unique visitors in a certain period of time which can be very different from the number of total users you have. Pageviews can sometimes be confusing, as they only show the total number of visits not counting the fact that a person can visit your website multiple times. That’s why keeping track of unique pageviews will make your life easier and will definitely help you understand how many people actually visited your website.You can find it right alongside your pageviews in your All Pages report. Go to Behaviour — Site Content — All Pages.
New and Returning Visitors
This metric shows how many new visitors you are attracting and how many visitors come back to your website. Always pay attention to the number of returning visitors, as it shows if your content is engaging or not.If you are attracting a fair amount of new visitors but not enough returning visitors, it means your content is interesting enough to visit your website, but not interesting enough to visit it twice.
Not a good sign, is it?
The golden middle is to both attract new visitors and retain the old ones. If that’s not the case something needs to change.
To track the number of new and returning visitors go to Google Analytics — Audience — Behavior — New vs. Returning.

Average Time on Page
On to the good stuff. Average Time on Page is one of my favorites as it shows how long users stay on your website, whether they read your content or simply pass by. It really feeds the narcissist in me when I see a high session duration.Basically if you want to find out what type of content your audience prefers, in which format, length and structure, then this metric will definitely come in handy.
To keep track of Average Time on Page go to Google Analytics — Behavior — Site Content — All Pages. This option will show you the time spent on each page of your website. If you want to see it for the entire website go to Audience — Overview.

Traffic Source
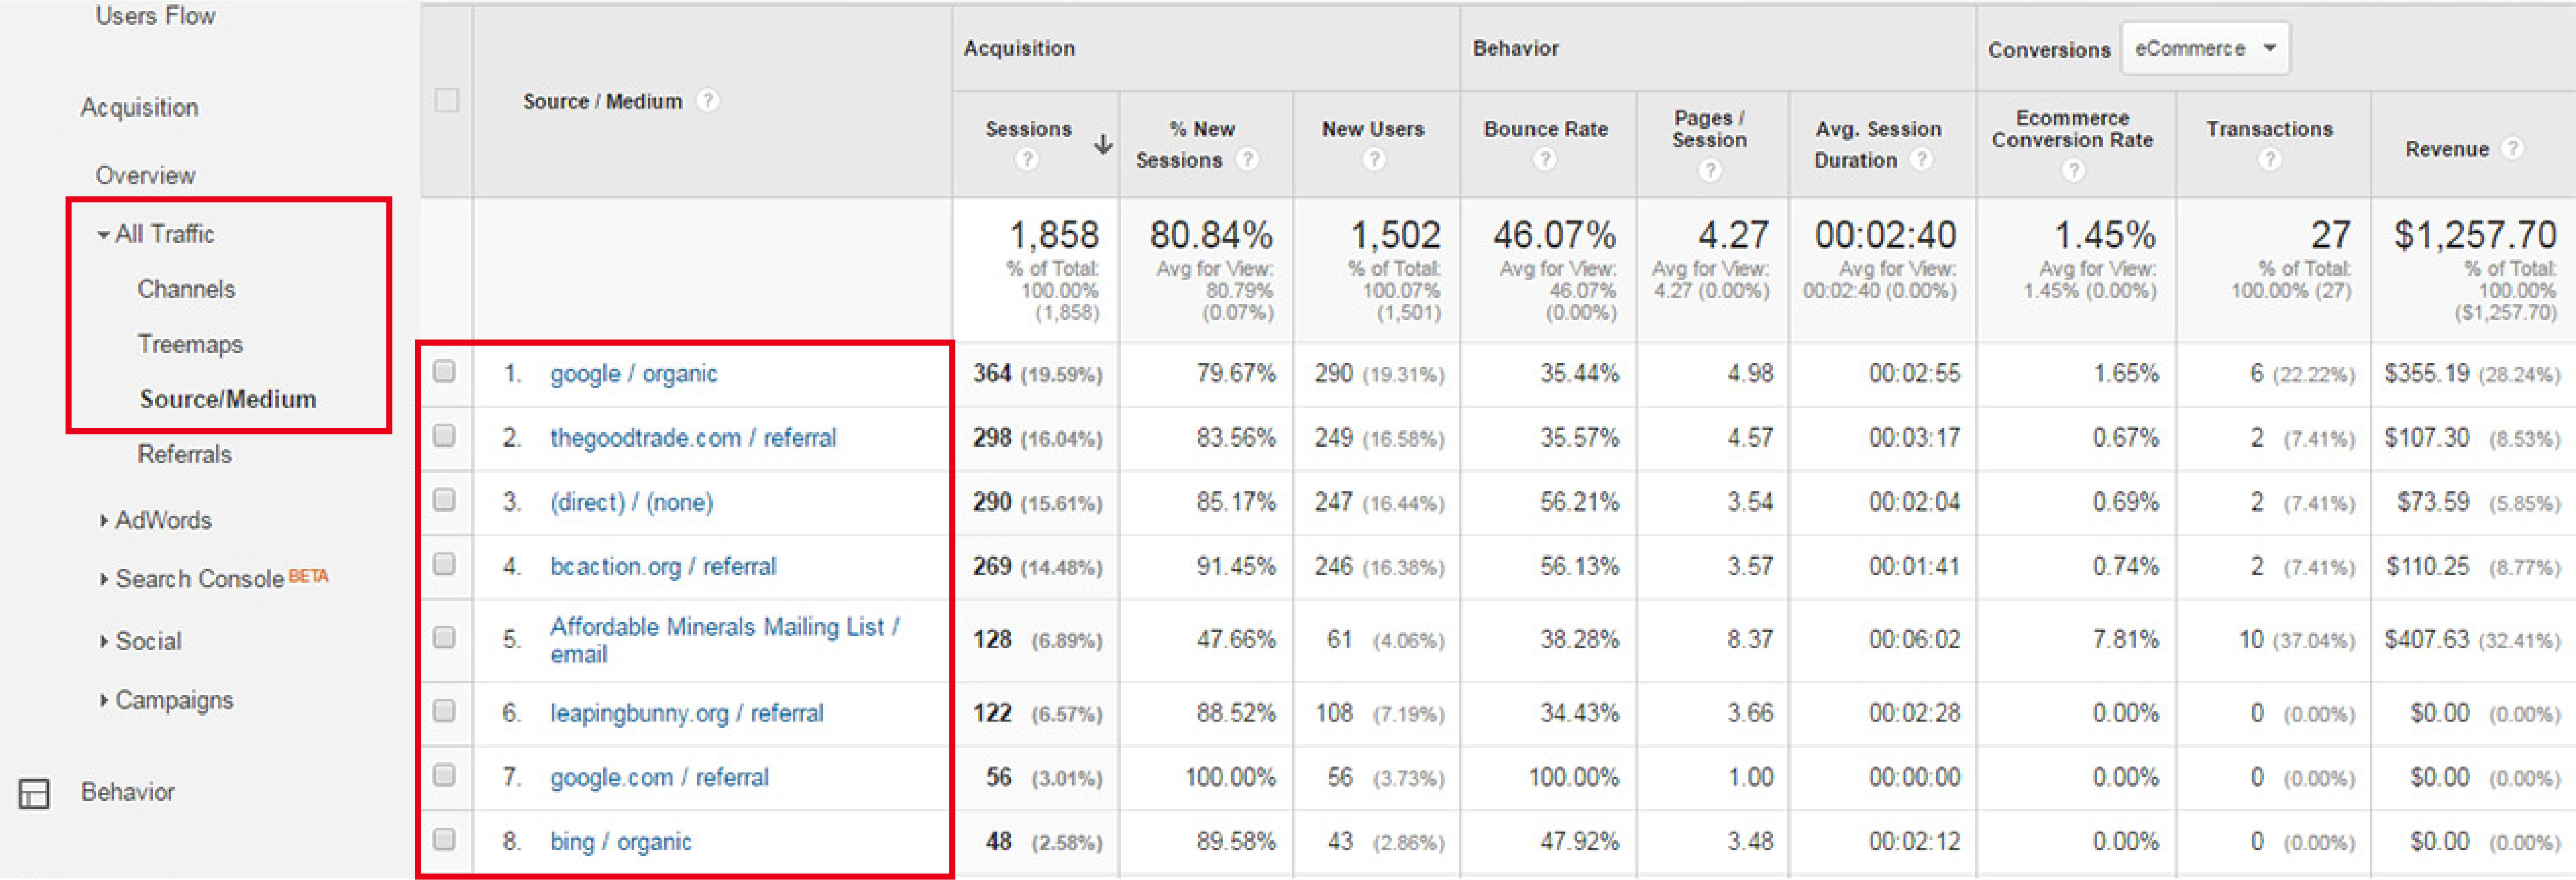
Traffic source is truly a goldmine of opportunities for perfecting your content strategy.As it shows from which sources users land on your website it makes it much easier to see where you are lacking and where your attention is much needed.
It’s essential if you want to find out what channels are most effective, whether your SEO or social media strategy is strong.
Whether you are getting enough hits from organic search, or alternative search engines. Whether your main traffic source is paid traffic.
Whichever the case, make sure to pay attention to this metric, so that you know where you should concentrate your efforts.
To see this metric go to Google Analytics — Acquisition — All Traffic — Source/Medium.
Bounce Rate
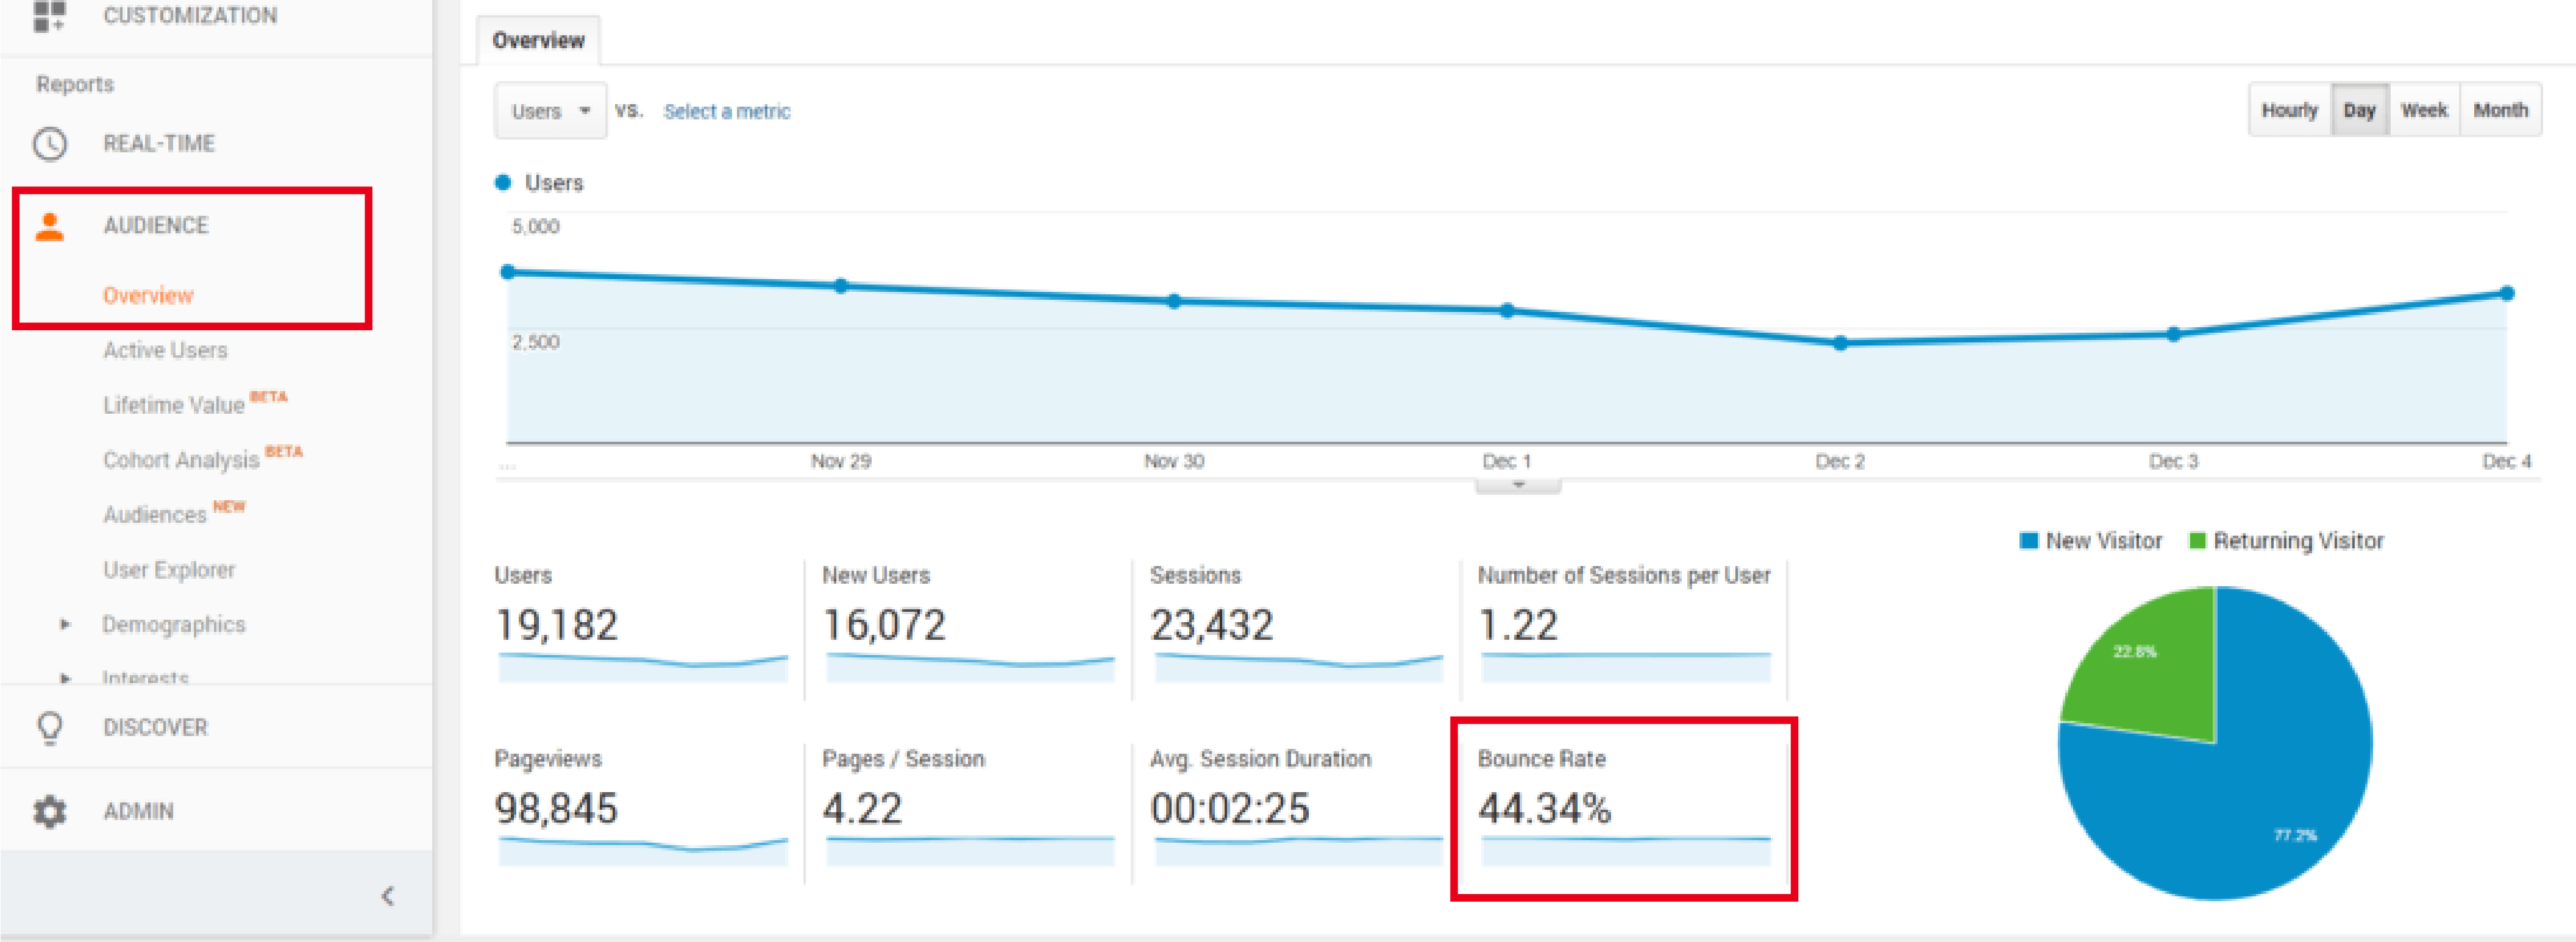
Last but certainly not least we have bounce rate which shows the percentage of people who leave the website immediately after landing on it. It’s a nasty metric I agree with and can sometimes make you feel like your efforts are all for nothing. But don’t you worry, some users may have accidentally clicked on the link and didn’t really intend to visit your site. Or something interfered with their search. It doesn’t necessarily mean their user experience was bad.I admit if you’re an e-commerce brand and have a high bounce rate on product pages, it’s a red signal and probably your sales are taking a hit. But for a blog, a high bounce rate can be normal if the number of returning visitors is moderately high.
To see this metric go to Google Analytics — Audience — Overview — Bounce Rate.
SEO Metrics
Time for my favorite part, where SEO comes to play. Obviously content creation is directly linked to your SEO efforts which makes it essential to keep track of your keywords, backlinks and such.Keyword Rankings
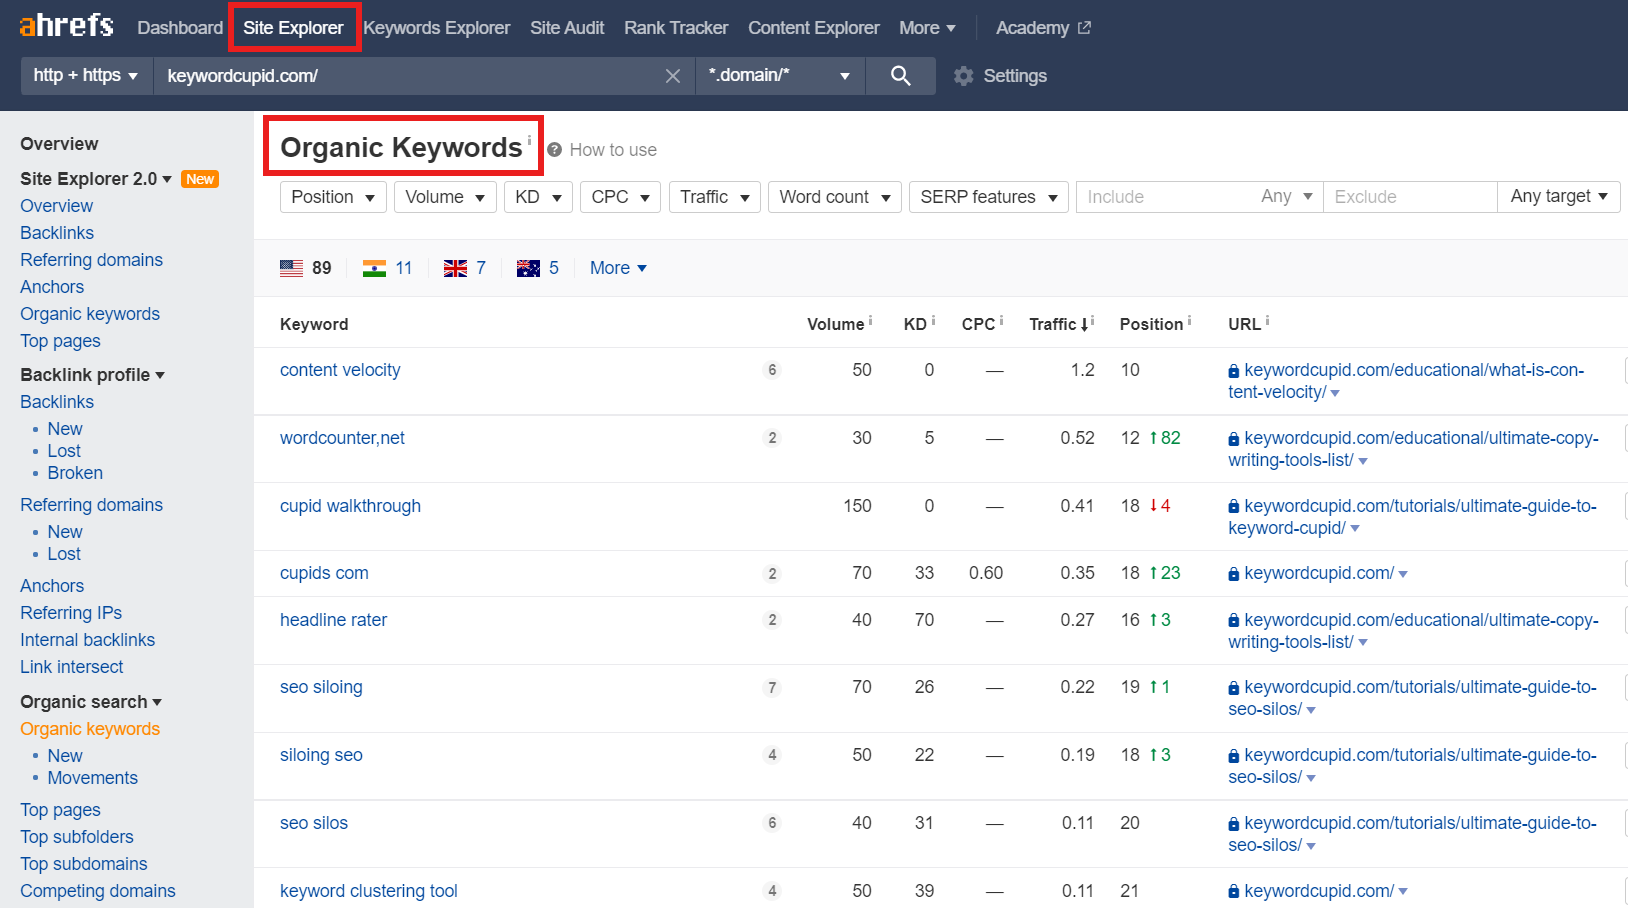
Arguably one of the most important metrics when it comes to measuring your content marketing success is keyword rankings. It clearly shows how your content is performing in the organic search, how many rich results and answer boxes you appear in and how much first page real estate you’ve conquered. Besides keeping track of your keyword positions and their sudden fluctuation can give you easy and quick insight into your search performance.You can track the average position of your target keywords by going to Google Search Console — Performance → Search results → “+ NEW” — add your target query in the filter.
An alternative would be to use a third-party tool such as Ahefs, Semrush, Agency Analytics or many others to keep track of your or your clients keyword positions.
Backlinks
Supposedly one of the most important ranking factors, backlinks are another indicator of your content performance. In this day and age acquiring completely organic backlinks seems like a fairy tale but if you are getting them it’s definitely a strong signal into your content performance.Alternatively, organically earning backlinks through active outreach is also a pretty good sign that your content is useful enough that other website editors are willing to share it with their precious audience.
If you want to see how many inbound links your content gets check out GSC. Go to Google Search Console → Links → Top Linked Pages
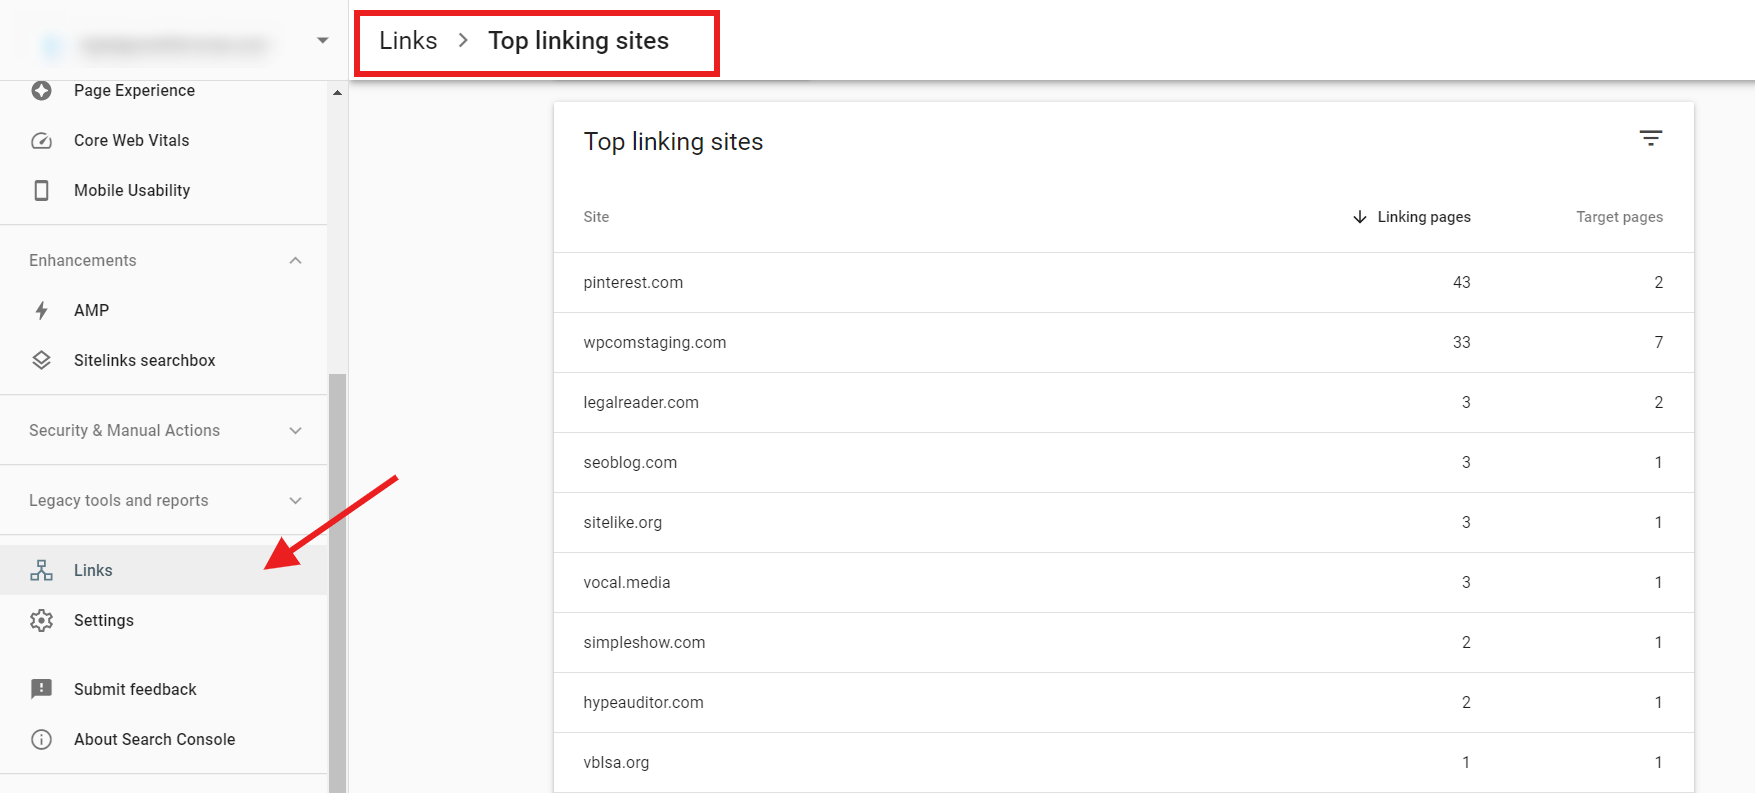
Of course you can use third party tools as well, where you can find more insight into your backlink profile.
Authority
While website authority isn’t the first thing that comes to mind when you think of content it can definitely be impacted by your content creation efforts. Domain authority or domain ranking is a made-up score as we all know it so each tool, be it Ahefs, Moz or Semrush have different ways of measuring it. But at the end of the day most of these scores heavily rely on backlinks which as we’ve seen have a significant impact on your content performance.Overall a high DR shows authoritativeness and higher rankings.

Engagement Metrics
My least favorite (I’m not a fan of social media, sorry) but considered the most important metrics by many we have engagement. It shows how you connect and interact with your audience. Although I’ve included some on-page engagement metrics as well that have nothing to do with social.What can I say, let’s get into it.
Comments
If you get comments under your posts, it shows that your content is so engaging that people want to discuss it. As we all know it takes more time to write a meaningful comment than just click on the like or share button.Pay attention to what people are writing and make sure to answer their questions or suggestions. If used and analyzed correctly it can be a great source of inspiration for future posts, not to mention a wealth of insight into your own audience.
Not to be confused by social media comments, blog post comments are another wonderful engagement indicator that clearly shows if your writing is read and appreciated. I know some people abuse website comment sections by trying to squeeze in a link to their website but you can easily avoid that by setting some commenting parameters in your wp dashboard.
Likes and Shares
Likes and shares might seem like superficial metrics but it can give some insight into how interesting and engaging your content is for your audience. You should compare the reach of your post to the number of likes and shares it has got.If your content is underwhelming your followers will definitely let you know so you better listen.
Note: shares are more significant indicators as they expand the reach of your content but they are a lot less common.
If you want to track Likes and Shares just look at each platform’s analytics dashboard. Most social media channels have one, where you can track likes, shares and your overall reach.
Republications
When a third-party website publishes your full article, infographic or report, it’s a day for celebration. This metric clearly shows how valuable your content is that other brands want to republish it and share it with their readers.Just make sure to keep track of such syndications and check the sites where your piece was republished. If the website that shared your content has higher authority you might rist losing rankings to said website. To avoid this contact the edits and ask for a canonical link pointing to the original article not to further confuse search engines.
Mentions
Mentions also talk volumes about the quality of your content. Mentions can be in the form of content roundups, a credit to the original source, a quote, a brand mention or something else. This is a metric that can highly depend on the author or the brand itself.Still don’t forget to pay attention to whether the link to your page is included in the mention.
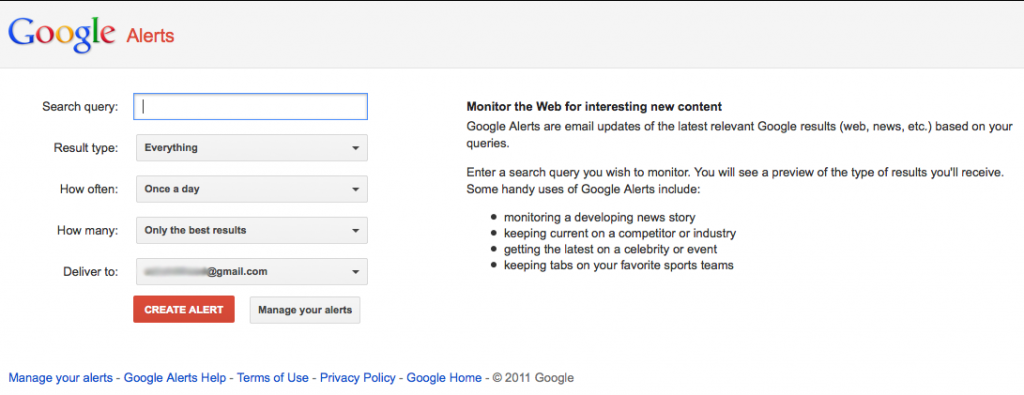
If you want to keep track of any brand mentions you can easily set up some Google alerts, or use alternative tools.
Revenue metrics
Let’s be honest, all those metrics we’ve gone over are very nice but if they don’t add to the bottom line nobody really cares, do they?For most brands all digital efforts, not just content are usually aimed at increasing sales and revenue. Of course content or SEO do not directly impact your revenue but they do create a great atmosphere for your band to grow and bring in target buyers.
Conversion Rate
The conversion rate shows how many people took the desired action of your campaign (click, download, subscription, trial, etc). This metric shows if you’ve achieved your goals or not. If you’re not getting enough conversions, you should change your positioning, target audience or content type and format. It’s important to track this metric regularly so that if something goes wrong you will notice that right from the beginning.To track this metric, you can use Google Analytics. Set up goal tracking and go to Conversions — Goals.
Number of New Leads
Leads😩. As a digital agency owner I feel like leads are by far the most important metric when it comes to my overall site performance and for a good reason. For service-based companies, leads are a lifeline, a new opportunity, a possible client.Tracking leads can be done in various ways such as sign-up for newsletters, downloads, pop-ups, contact forms, free consultations or direct emails. The possibilities are endless here as each brand has its own funnel. Regardless you can measure your lead sources depending on your strategy.
You can set up Goal Tracking in Google Analytics to measure this metric.
Number of Existing Users
This metric is somewhat similar to returning visitors as it shows users who found your content so interesting the first time around they decided to come back for more.These people can potentially become future clients as they are clearly starting to get invested in your brand. That’s precisely why it’s one of the most important tracking metrics in my opinion and you need to nurture and handhold them throughout the entire customer journey.
Content Marketing ROI
We are nearing the finishing line and here comes the most asked question of them all: how much ROI will I get if I invest X amount into content?Well, it’s not really that simple to calculate but let me try anyway.
ROI (return on investment) obviously shows how much revenue you’ve got from content and other resources spent for content production. Simply put it shows if your efforts paid off.
There is a general the formula for calculating Content Marketing ROI:
Content Marketing ROI = ((Return on Investment – Investment)/Investment) x 100
The gist of it is if you’ve spent 400$ on content production and distribution and gained 1000$ in sales, then your Content Marketing ROI is ((1000 - 400)/400) * 100 = 150%.
To say it’s confusing is an understatement. Content alone cannot be responsible for your sales revenue which makes this equation error-prone but it still gives you a pretty good idea of what to expect.
Still, don’t rely on it too much. You can never get the whole picture only with ROI.
Sum Up
That about sums it up, some essential metrics to help you assess your content marketing performance.The bottom line, make sure to set realistic goals with exact KPIs and track them regularly. If you are not aware how your efforts are paying off, it's a lost effort.
Make sure to read the Keyword Cupid blog for more interesting content marketing insight.
And check out Keyword Cupid if you are in the market for a stellar keyword clustering tool, your content marketing strategy will feel the difference, trust me.
See you in the next one!


